Topics to be discussed in this section:
Automated chart. Criticality view.
Definition of Facilities to contain zones and conduits.
Creation and definition of zones and conduits, along with their respective components, identifying levels of criticality.
Based on the general topics learned in the previous chapter, we’ll now look at how to create a project from scratch.
If we’re ready, once we’ve logged into our RECIN account, we must select the «New Project» button to create a blank template.

Before you begin filling out the form, it’s important to note that for security reasons, please do not include sensitive or confidential information in your project, as it is not necessary for the purpose of RECIN.
The first thing we must do is enter the name we want to give to the project, the type of sector in which we will develop it, the type of project in such sector, the approximate size of the industrial organization and the level of technological maturity that is available in such organization (if it only has basic automation, if its implementation has the integration of IT and OT or if it is already in a more developed phase towards Industry 4.0 with industrial digitalization implementations):

Automated chart. Criticality view
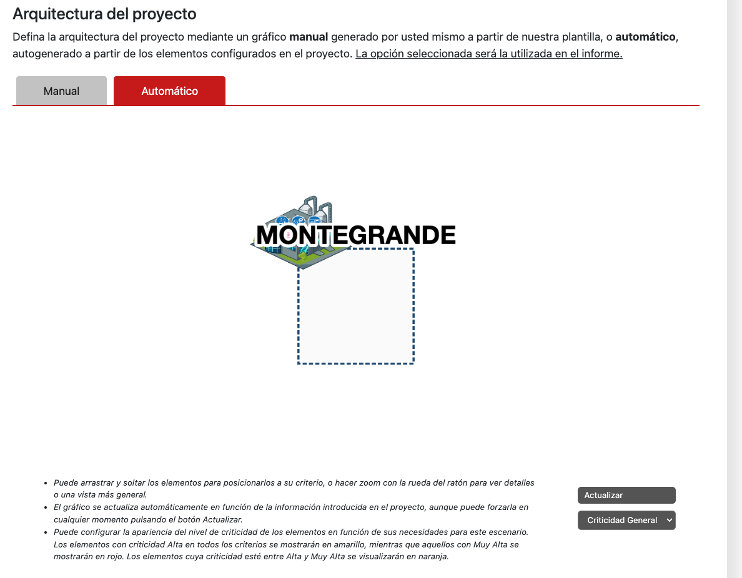
The second thing we must do is decide whether we want to upload a map of an existing architecture designed based on zones and conduits, or if we want the platform to automatically generate one from the data we upload. If we select an automatic graph, the graph will be filled in as we add installations, zones, conduits, and components. However, due to the complexity of positioning it, we must do this task by simply selecting any level (installation, zone, duct, or component) and moving it sideways to separate it from the rest of the created components.
Once we have completed our project inventory and the graph properly arranged, saving it will maintain the defined positions. We will also be able to view the different elements of the graph according to the criticality defined based on their needs for this project:
- Elements with High criticality across all criteria will be displayed in yellow.
- Elements with Very High criticality will be displayed in red.
- Elements with a criticality between High and Very High will be displayed in orange.

Definition of Facilities to contain zones and conduits.
To add a new facility, you need to press the «Add Facility» button, and in the dropdown options, define the name you want to assign to it, select the type of facility being defined (such as a corporate office, an industrial plant, etc.), and optionally add a description.
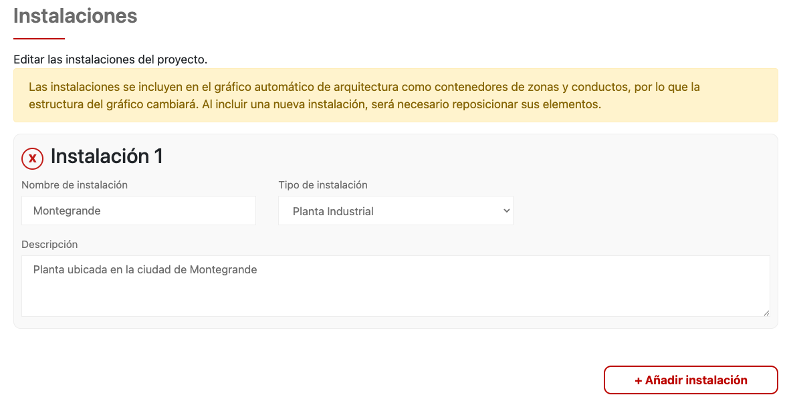
Once added, it will be visible on the chart if you had previously selected the automatic chart.
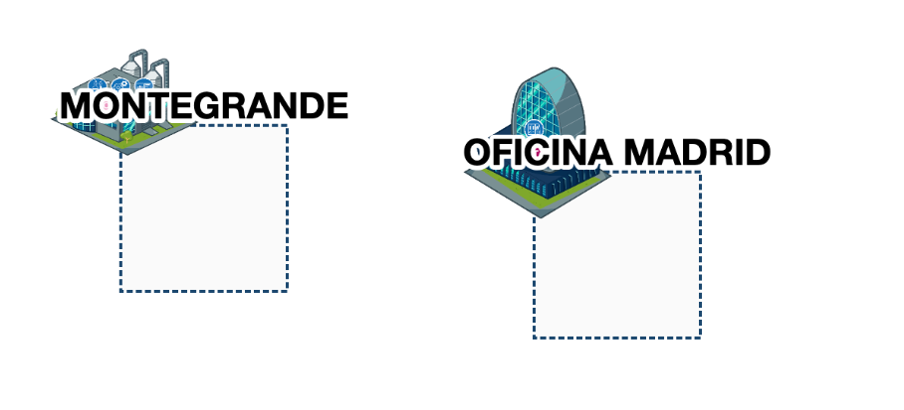
Repeat the process to add all the facilities you want to document for your project.
Creation and definition of zones and conduits, along with their respective components, identifying levels of criticality.
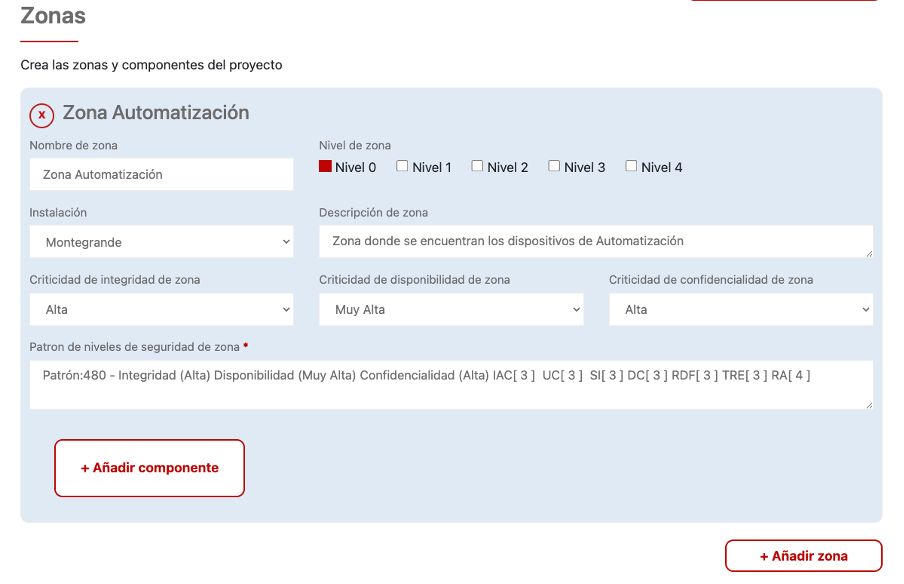
To create zones and their respective components, you must press the “Add Zone” button.

and complete the indicated fields, identifying:
- the name you want to use for the new zone,
- the zone’s description,
- the type of installation defined above to which it belongs,
- the level to which the components you defined for that zone belong (keep in mind that the list of components that will be displayed later is related to the levels selected in the zone).
- The zone’s criticality levels, including Integrity, Confidentiality, and Availability. (These levels will be inherited by the components that are later added to the zone; however, these levels can be modified for each component if you want to assign different values to those of the zone).
To create components within a zone, you must select the “Add Component” button in the zone where you want to create it and then specify:
- the name you want to use to identify the new component,
- the type of component based on the Level selected in the zone above,
- the number of components with those characteristics in that zone (to avoid duplicating components in the graph),
- the component’s criticality levels, including Integrity, Confidentiality, and Availability. Remember that these levels have been inherited from the zone to which they belong but can be modified if desired.
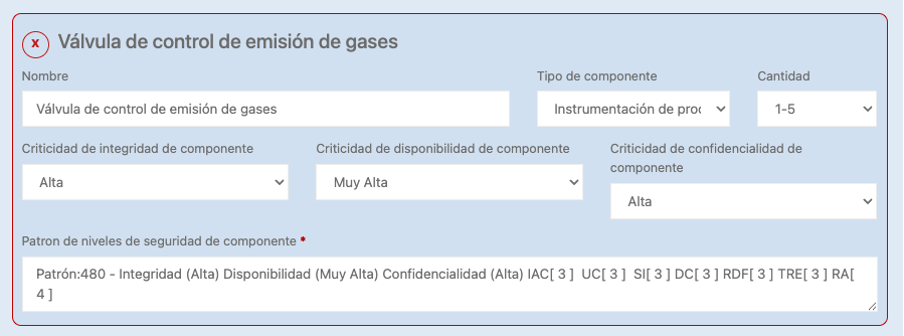
We will see that a pattern is also automatically generated in the components as we have described above.
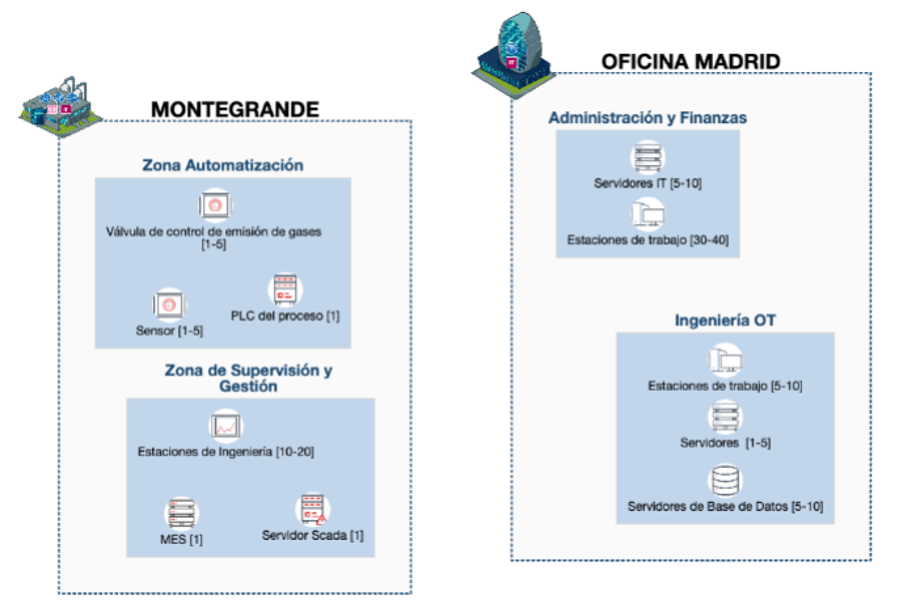
Once the zone and its components have been added, they can now be displayed in the graph within the corresponding installation if you had previously selected the automatic graph.
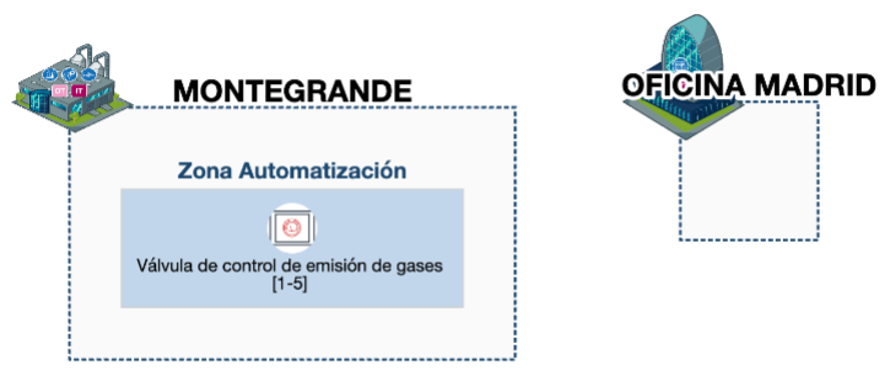
We repeat the process to fill our project with as many zones and components from each zone as we need and our membership level allows.
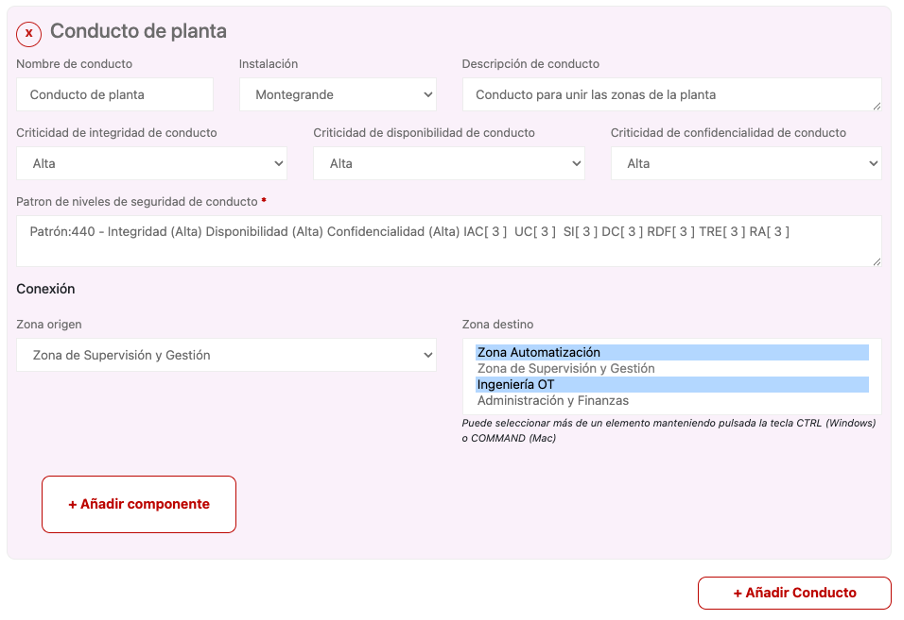
To create conduits and their respective components, you must follow a very similar process to creating zones, so we first select the «Add conduit» button and then fill in the information related to the conduit:
- the name you want to use to identify the new conduit,
- the description of the conduit,
- the type of installation it belongs to (from those defined above),
- the conduit’s criticality levels, including Integrity, Confidentiality, and Availability. (These levels will be inherited by the components later added to the conduit; however, these levels can be modified for each component if you want to assign different values to the conduit)
- the source zone and the destination zone(s). (You can select more than one element by holding down the CTRL key on Windows or COMMAND on Mac)
To create components within a conduit, you must select the conduit where you want to create it, the “Add Component” button and then specify:
- the name you want to use to identify the new component,
- the type of component,
- the number of components with those characteristics in that zone (to avoid duplicating components in the graph),
- the component’s criticality levels, including Integrity, Confidentiality, and Availability. Remember that these levels have been inherited from the zone to which they belong but can be modified if desired..
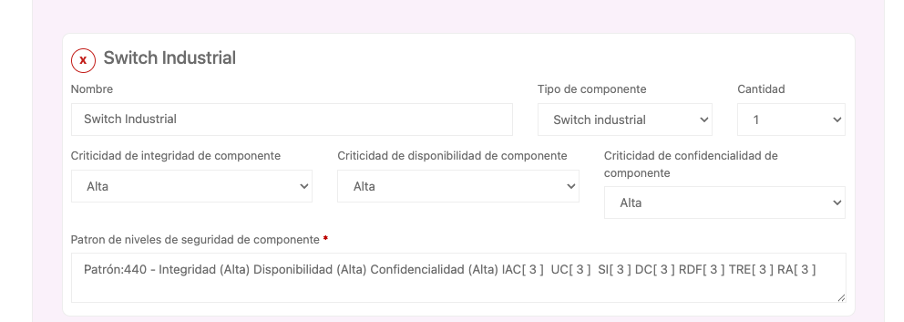
We repeat the process to fill our project with as many conduits and components for each duct as we need and as our membership level allows. Once the duct and its components have been added, they can be displayed in the graphic within the corresponding installation if you had previously selected the automatic graphic.
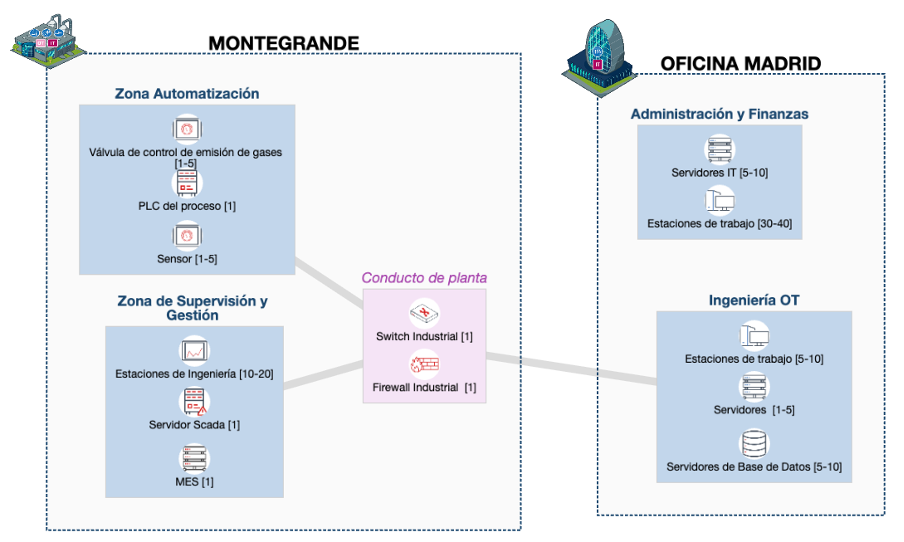
Once the information for our architecture is complete, press the “Save Project” button.